Observations on Observability
This article expands on one section of my talk What Lies Between: The Challenges of Operationalising Microservices from QCon London 2019.
Over the past few years, observability has become a prominent topic in distributed computing. Observability means different things to different people and the use of the term is still evolving, but, essentially, observability refers to the practice of using instrumentation to understand software systems in order to derive superior operational outcomes, like a superior customer experience, reduced operational costs, greater reliability, or product improvement.
I do not like the term observability as it is currently used in the software industry. This article is my attempt to reflect on the emerging observability practices and explain why I do not like the term observability being applied to them. I was somewhat hesitant to publish this essay, as I think some people will find it pedantic—like I am splitting hairs. If that is the case, feel free to stop reading and these words can remain my personal indulgence.
In this essay, I do not reference prominent tools, writing, or presentations on the subject of observability. This is intentional. I think much of the work in this space is well intentioned and serves a purpose. Based on where I think the software industry is heading, however, it is my opinion that the way we are using the term observability now will be different from how we will want to use it in the future.
Observability: The Current Narrative
From my perspective, the current observability narrative goes something like this. Observability has its origins in control theory, where observability describes whether the internal state-variables of the system can be externally measured or estimated. In a similar manner, we can gain insight into software systems through direct or indirect measurements.
Most software systems achieve observability by instrumenting and recording requests and responses, either through logging, tracing, or metrics. At scale, instrumenting every request becomes prohibitive in terms of both performance and cost, so sampling is used to reduce the impact, while still providing statistically valuable insights, and/or the data are only retained for a short period of time.
Observability is similar to software security, performance, and quality in that it must be considered holistically and not just tacked on after the fact. This leads to a strong argument for developers operating the systems that they build—rather than turning them over to a separate operations team—so that there is a feedback loop in terms of what needs to be observable in order to operate the system effectively.
Most observability data is augmented with rich metadata that includes things like the unique request-identifier, the customer, the software version, the service name, the datacenter, and so on. This rich metadata allows us to ask arbitrary questions about the system, since we can slice and dice the data after the fact and we do not need to know all of the questions that we want to ask, upfront. This can provide tremendous operational flexibility, but it can require sophisticated analysis tools, and involves a lot more than just producing and storing the raw data.
Why Do I Dislike the Term?
Based on this narrative, observability sounds great. So why do I dislike the term? In control theory, the dual of observability is controllability. Controllability is the question of whether an input can be found such that the system states can be steered from an initial condition to a final value in a finite time-interval. Rather than asking arbitrary questions, observability, in relation to controllability, asks very specific questions. In a state-space representation of the system, observability is determined by the rank of the observability matrix—a strict, mathematical definition.
It seems to me that people are borrowing the word observability from the well-established discipline of control theory to give what we are doing in computing more legitimacy, just by association. In software systems, what is currently referred to as observability—usually some combination of logging, tracing, and metrics—provides varying levels of visibility, debuggability, traceability, discoverability, but not observability, especially as it relates to controllability. Perhaps we can call what we are currently doing visibility? Or if we want to emphasize the importance of inference through indirect measurements, maybe we can call it discernibility?[1]
Current observability tools have a very narrow scope, mainly limited to request-response systems. We need tools that move beyond the focus on requests and responses. While HTTP request-response forms the backbone of many services, the majority of the systems that I have worked on in my career have been time-series systems, which have streaming and publish-subscribe messaging as the dominant communication patterns. We need tools that can provide insight into the dynamics of streaming-data and event-based systems, like systems designed for interfacing with millions of IoT devices. We also need insight into events at rest, in persistent storage, so that we can verify the integrity of the data when we read it back,[2] or identify specific customer-data so that it can be deleted to satisfy regulatory requirements.
Pigging
Pigging is a technique used in oil and gas pipelines. A pig is a large, cylindrical device that is the same diameter as the pipe. The pig is inserted into the pipe and moves along the pipeline with the flow of product. Pigs support maintenance operations, including cleaning, inspecting, and preventing leaks, without necessarily stopping the flow of product in the pipeline.
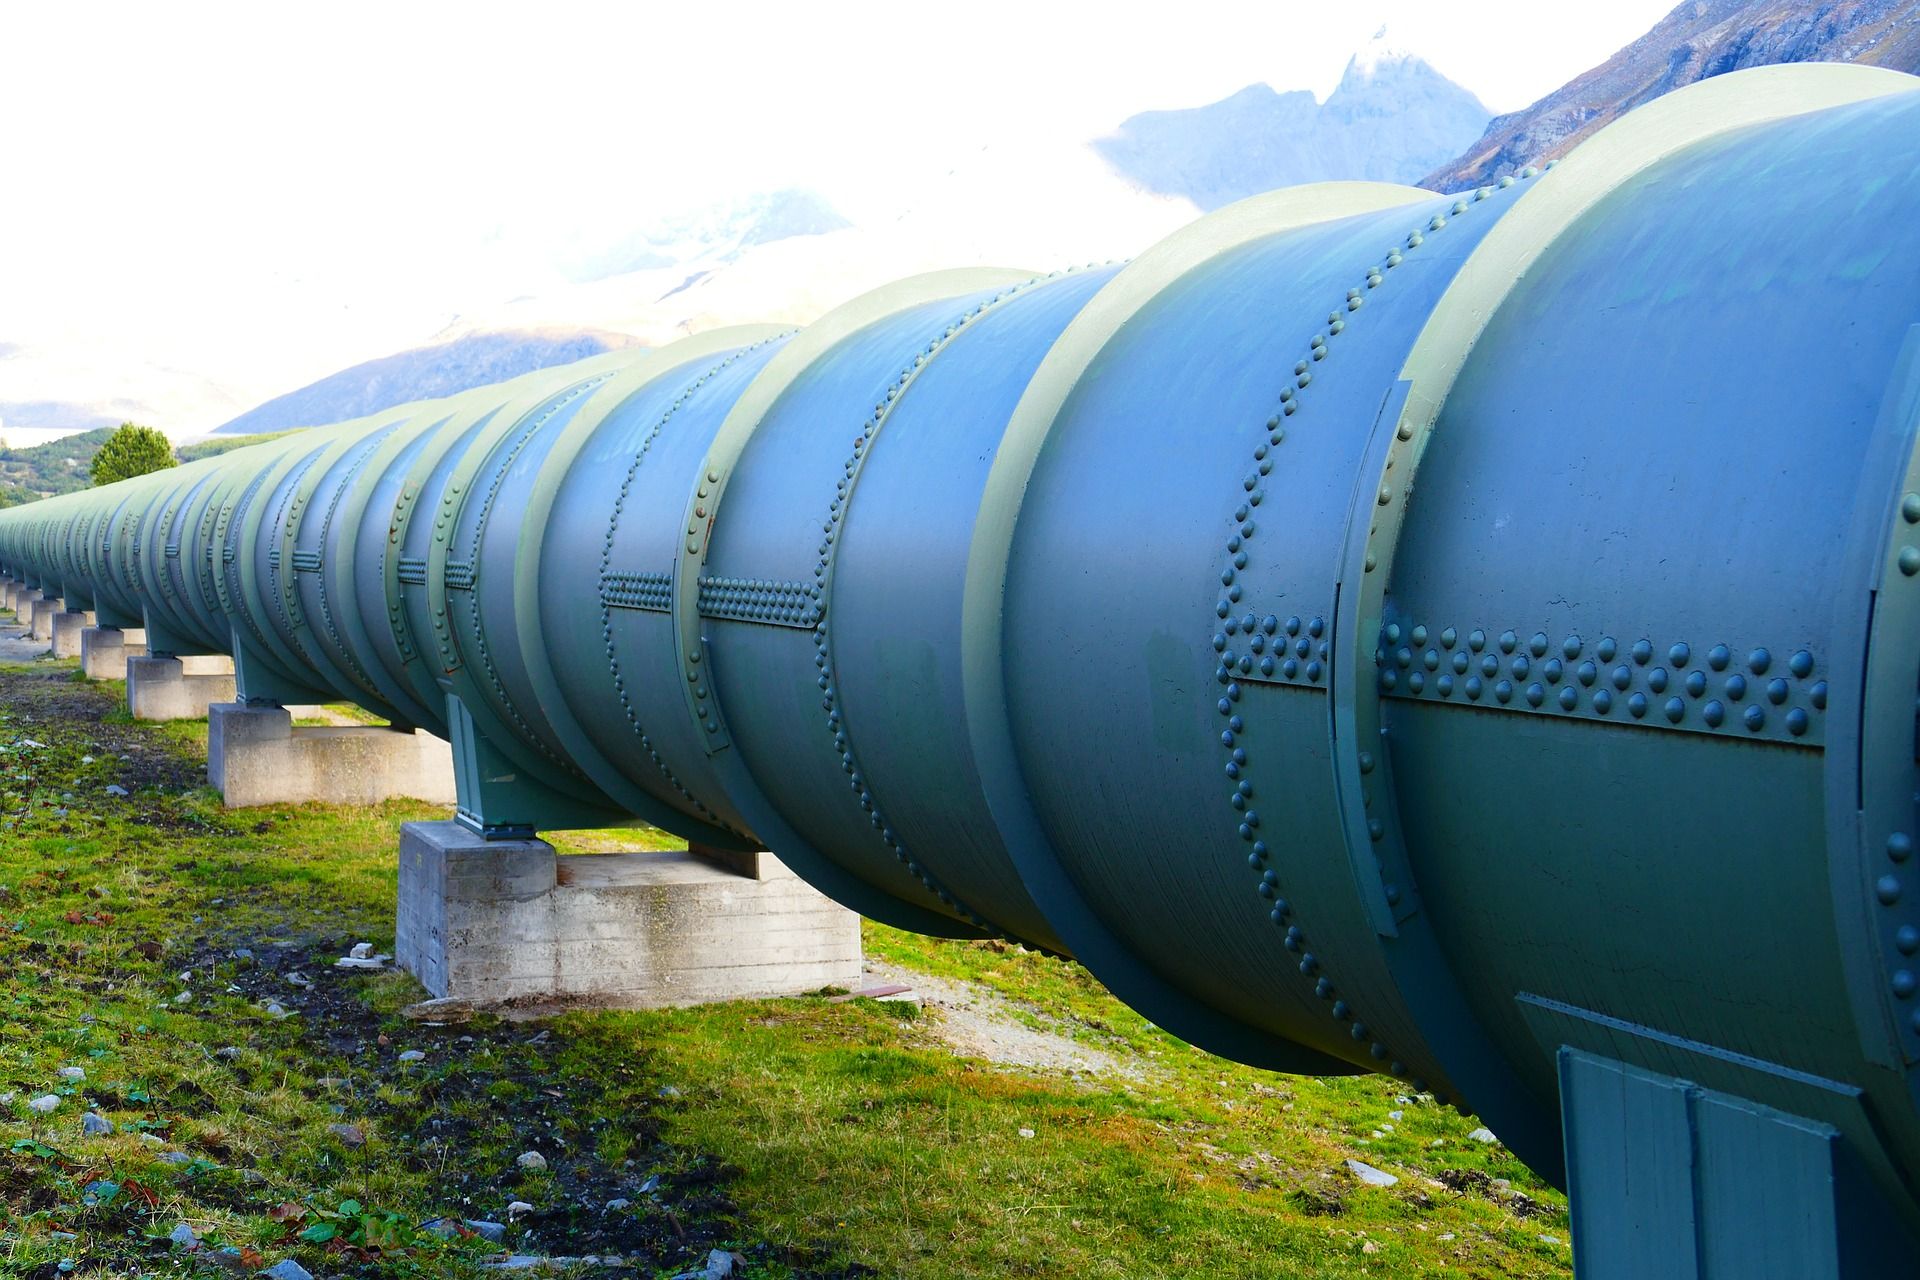
The current focus in software observability on request-response messaging and tracing how a single request is satisfied by many collaborating systems, is our equivalent of pigging. Logging, tracing, and metrics can be invaluable tools for understanding the genealogy of a single request—for example, someone in customer service might be able to identify why a customer's specific transaction failed or is delayed; or an aggregation of anomalous requests to a single service may help identify that a service has failed—but trying to make sense of the dynamics of a complex system, in aggregate, at scale, by sorting through a huge number pigs, is very limiting.
Pigs are not used to operate oil or gas pipelines on an ongoing basis. Continuous operation relies on continuous signals: flow rates, pressures, temperatures, mass balances. Similarly, an oil refinery, which is arguably much more complex than most software systems, is not operated by observing how every single hydrocarbon flows through the system. Empirical methods that rely on continuous signals are used for control and continuous process-improvement. For a distillation column, the external dimensions of the tower—the computing equivalent of tagging events with static metadata—do not even tell us much. We need to understand the desired split of components, the operating pressure, the location of the feed tray. In other words, we need to understand the dynamics, operating conditions, and control objectives for the entire system.
At scale, digital becomes analog.
— Michael Feathers
Fortunately, as discrete pieces aggregate, they start to look continuous. At scale, we can take advantage of this, embracing higher-level metrics that can be treated as continuous signals.
Where I Think We Are Heading
When I look at the dynamics of software systems, they remind me of the mechanical, chemical, and electrical systems studied in engineering. Processing a stream of messages from a message queue is similar to a flow rate of product. Understanding if messages are accumulating in the queue is similar to a mass balance.[3] We might control a process with a bounded queue of messages in a similar manner to how one would control the level in a holding tank, manipulating the input and output flow rates, tuning the controller to track the setpoint, or reject disturbances.
I believe we will eventually view software systems as dynamical systems and we will embrace models that rely on essentially continuous signals in order to control these systems. Operating software systems at scale will look like process engineering and systems engineering. This transition to taking a more systems-engineering approach and using the right semantics will help us operate our systems more efficiently and reliably. We will identify stochastic processes and we will be more careful in understanding if the measurements that we are using are independent, or if they are auto-correlated, or cross-correlated. We will study the systems and controllers we build to understand their dynamic response and stability. We will develop more rigour in understanding what can be observed, what can be modelled, and what can be controlled.[4]
There has been some mention of closed-loop control in software systems in recent years.[5] Certainly desired-state configuration, managed by systems like the Kubernetes Control Plane, is a loose form of proportional and integral control. However, we will need to borrow more sophisticated models from control theory to deal with the complex dynamics of software systems and ensure they obey operating objectives. Controllers can be very sensitive to measurement lag. Perhaps first-order plus dead-time models will prove useful. To me, scaling up worker nodes in a cluster looks like a first-order plus dead-time process: there is a dead-time as the servers are provisioned, then the response is first-order as the workers handle more and more load. Or maybe we will use techniques like Model Predictive Control (MPC) to perform optimal control, based on past measurements, while respecting constraints. Our constraints might be things like response time, the number of servers, queue size, energy consumption, and cost.
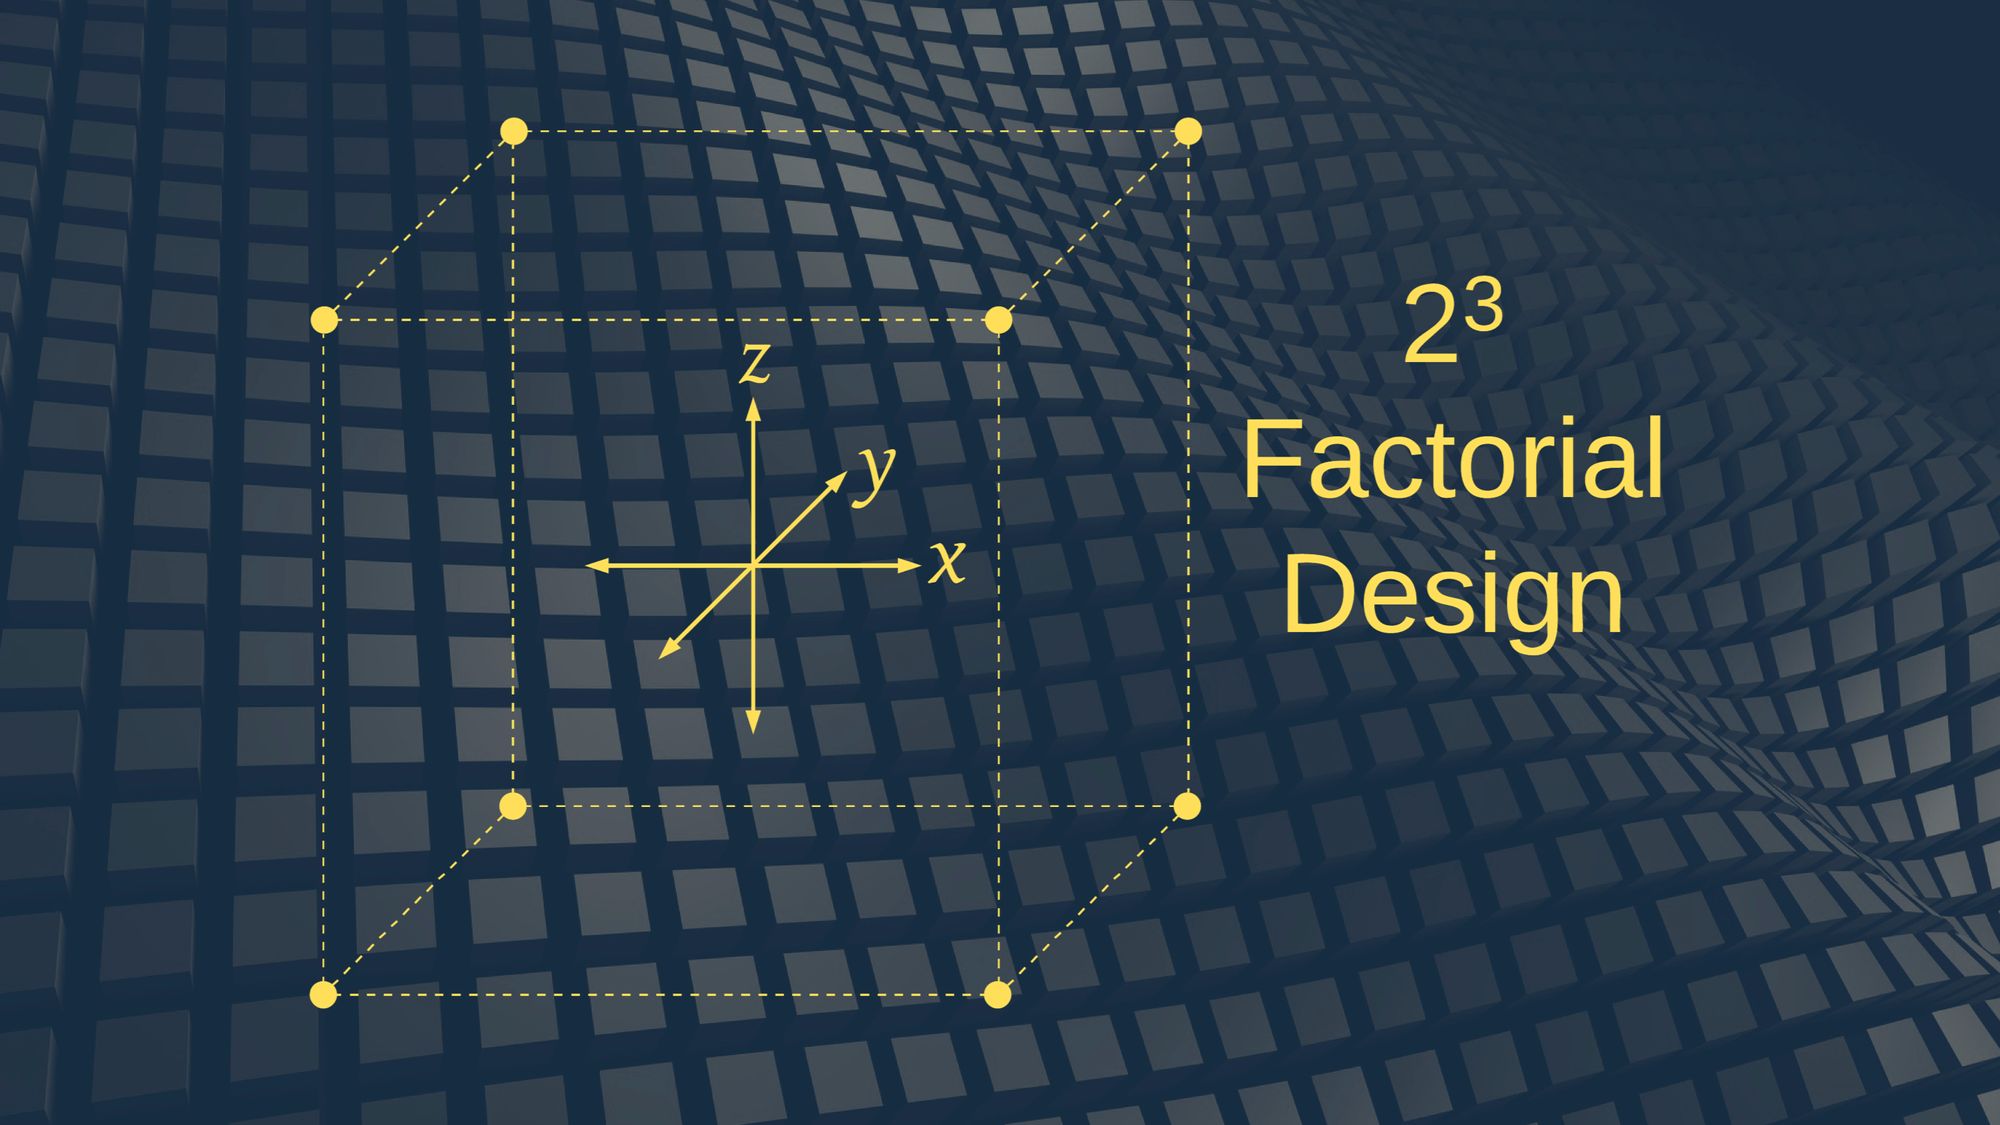
The state-space that software systems operate in is non-linear and there are local and global maxima in terms of the most effective operating conditions. We will need to use techniques for continuous improvement that have been used in the process industries and in manufacturing for decades. Techniques like Design of Experiments, including Factorial Designs; or Fractional Factorial Designs for large state spaces. We will use these experiments to find more optimal operating conditions, maximizing an objective like message throughput, or minimizing latency or energy consumption, while adjusting the number of threads, CPU allocation, server instance-type, or container affinity. Just like in the process industries, this testing will happen in production and it will be continuous.
Telemetry, Correlation, Cardinality
I find log messages and traces as useful as the next person, but the most valuable thing to me in operating software systems and understanding their dynamics is having fine-grained telemetry from each service. I think of instrumenting a software system as one would instrument an industrial process, thinking in terms of flow rates, holding times, mass balances, counts, and so on, and whether or not I can observe the system dynamics that I want to study. For example, I might want to understand the overall message rate for a service, as well as breakdowns for the different types of messages it processes, or the number of discreet error conditions that have been encountered. This type of telemetry can be reported using very light-weight counters, then computed and aggregated after the fact.[6] This type of telemetry has a lot of advantages in terms of performance, scalability, testability, as well as composability.[7] The data can also be retained cost-effectively for a long period of time. In addition to providing great operational insight, I think this type of telemetry will eventually become the basis for controlling the dynamics of software systems in more sophisticated ways.
In developing software observability, many people recommend measuring only what you need, not necessarily what you can. For example, why measure every step in a message-processing pipeline, when the vast majority of messages are transmitted through the entire pipeline? Avoiding redundant measurements—either direct or indirect—is a way to tame the huge volumes of data and focus our attention on what is most valuable. This makes sense for redundant logs statements or traces, but it is not good advice for telemetry, for a number of reasons.
We usually do not know all of the questions that we want to ask upfront. How many times have you been troubleshooting a problem with the data that are available, only to realize that you need more detailed telemetry or logging in order to make sense of what is going on? This is why I am of the opinion that we should record as much data as reasonably possible, upfront, because it allows the greatest flexibility in asking questions of the data later. This is one of the reasons that I like using fine-grained telemetry, because it is cheap to produce, collect, store, and analyze. It is cost effective to collect a large amount of telemetry from every service at a high frequency. Tagging this kind of telemetry with rich metatdata is also more stable in terms of cardinality. For example, the aggregate message-rate for a streaming-service tagged with metadata like the service name, the software version, the datacenter, and so on, will produce data with much lower cardinality as compared to recording every single request with a unique identifier.
In addition, collecting what might look like redundant signals can be advantageous when the correlation among these signals starts to break down, allowing us to identify failures or changes in behaviour. Drawing correlations, or the lack there of, among series, is often what we are doing when looking at dashboards. A colleague of mine has developed a mental model where he can infer most dynamics and operating states—normal and abnormal—of a messaging system, just by looking at the relative network-out for each sever in the cluster. We can formalize this using multivariate approaches, like those that have been adopted in the process industries, in a similar shift from operating systems based on our intuition, to using more formal methods for monitoring and control. Multivariate methods may even derive insight from signals that we disregard as unimportant.
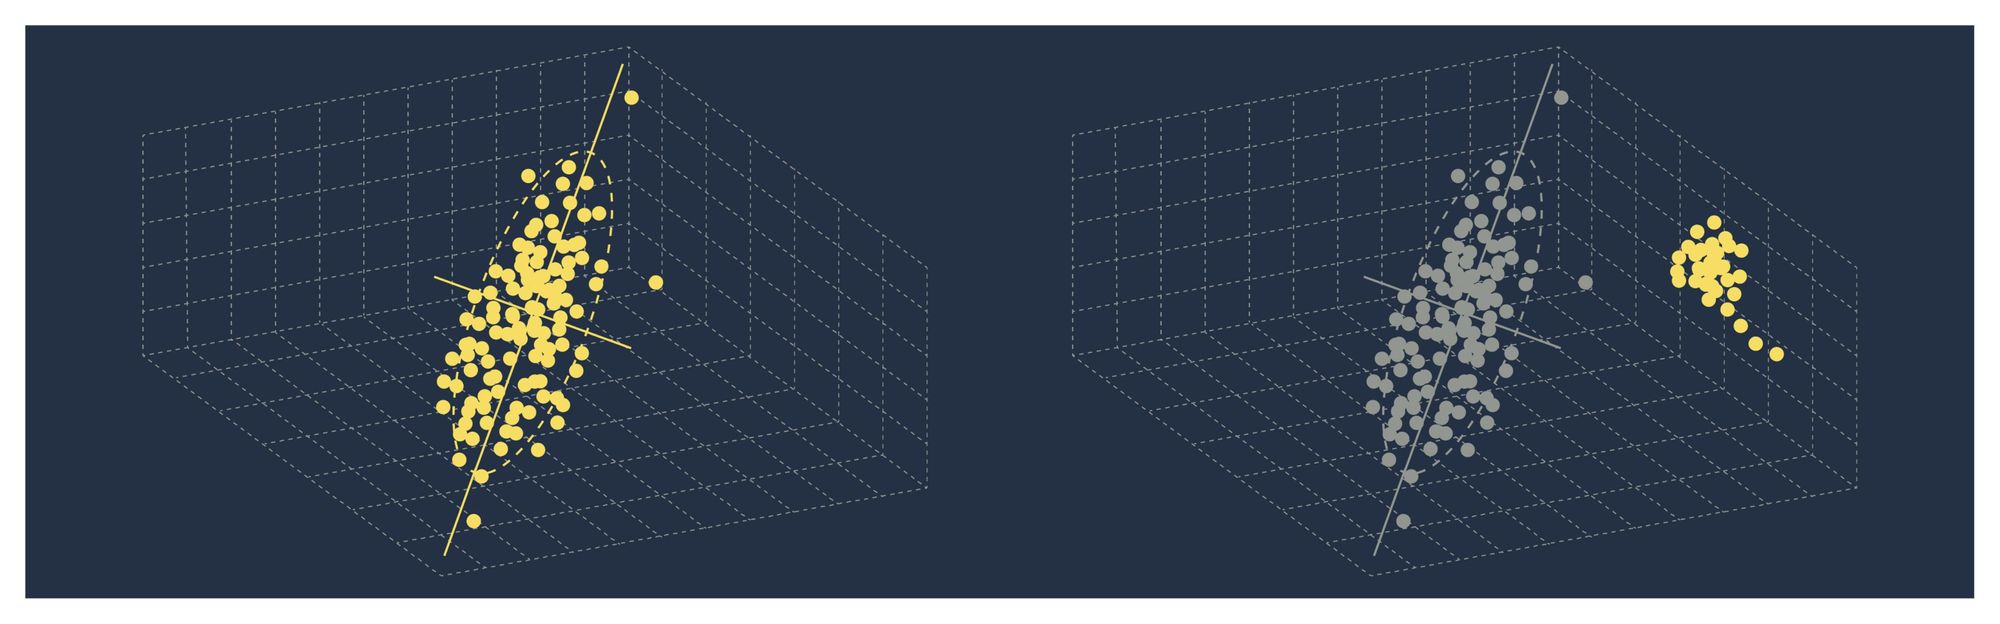
Consider the following set of measurements in a multi-dimensional space. The majority of the variation can be described by a lower dimensional, latent-variable space, that could be described by using a multivariate, statistical technique like Principal Component Analysis (PCA). Not only would this give more insight into highly correlated signals, it could also help identify new, unique operating conditions, or predict the onset of failures, before they become critical, as the correlation among these variables starts to change over time. Using statistical-process-control charts will allow us to judge whether services are meeting service-level objectives more effectively than looking at dashboards and using our intuition.
Conclusion
Many organizations are developing observability tools. There is also a feeding frenzy of vendors trying to corner the market on observability tools—every vendor has their own observability guide—and it seems every conference presentation must mention observability. Most of these efforts are well intended, but the tools, while improving, remain nascent, narrowly focused, and somewhat naive. I believe there must be people experimenting with more sophisticated techniques, but these are not the people that are getting the attention of the observability space dominated by logging, metrics, and tracing.
At a small scale, like when we are tracing a single request, or interpreting logs from a single container, these tools are necessarily powerful. Understanding the rich detail gives us a sense of control. But as we start to zoom out, at scale, trying to understand all of the detail is impossible—details do not compose. Our understanding of the system and our sense of control erodes.
The more details we can see, the less we have a sense of control.
— Mark Burgess
I think the future of operating software systems at scale will look like process engineering. We will rely on continuous signals and look at software systems as dynamical systems. We will embrace similar techniques for process control and continuous improvement. This is why I do not like the term observability as it is currently used. In operating software systems at scale, we may want to reserve the traditional definition of observability as it relates to controllability.
Interestingly, the term observability has also been used in Cognitive Systems Engineering in relation to helping people discern the behaviours of autonomous control systems: "Increasing autonomy and authority of machine agents without an increase in observability create automation surprises." ↩︎
See Observations on Errors, Corrections, & Trust of Dependent Systems by James Hamilton. ↩︎
Certainly queuing theory is a well-developed field in computing, but these types of models do not seem to be prominent in most observability tools. ↩︎
My calculus professor in my first year of university, Dr. Boyd, always joked that he "like to avoid the rigorous method, because with rigour comes mortis." ↩︎
Colm MacCárthaigh gave a very interesting presentation entitled Close Loops & Opening Minds: How to Take Control of Systems, Big & Small where he hints at the possibilities of using proportional-integral-derivative (PID) controllers for software systems. He doesn't go into too much detail and most of what he does go on to present is relatively simple—techniques like rebooting, throttling, full-synchronization, and immutability. There is, however, beauty in this simplicity. It should be noted that I am not suggesting that we build systems or controllers that are more complex than they need to be. Many physical systems, or systems in the process industries, have analogous, simple, fail-safe mechanisms, that just work. ↩︎
For example, there is no need to record rates—just record counts and differentiate after the fact. Instrumenting software with counters like this is not new. This is how Windows Performance Counters work and they have been around for decades. ↩︎
I wrote an article on testing performance counters: Writing Automated Tests for Custom Windows Performance Counters. ↩︎