From a Time-Series Database to a Key Operational Technology for the Enterprise: Part I
This three-part series expands on a talk that I gave at a conference focused on time-series data in 2018.
Many people are familiar with using a time-series database for collecting metrics from servers, applications, databases, and services running in a data center. A time-series database can provide valuable insights into operating these systems more reliably and cost effectively. Looking at time-series historically allows us to understand the dynamics of workloads, it helps with troubleshooting problems, and it informs capacity planning and service-level agreements. The near real-time nature of time-series data supports dashboards for monitoring, as well as automated alerting for significant changes in operating conditions.
However, for almost all of us, the servers, applications, databases, and services that we are monitoring in the data center are not the main concern of the enterprise. Our businesses are ultimately concerned with manufacturing products and delivering services—generating electricity, manufacturing pharmaceuticals, transporting goods, providing health-care services, and so on—with the services in the data center playing a supporting role. Even if we are in the data center business, we are as concerned with monitoring the heating and cooling systems, and managing the power-usage-effectiveness (PUE) ratio, as we are with monitoring the servers and infrastructure—essentially making the data center look as much like a chemical or mechanical engineering process, as it is an information technology (IT) one.
In this essay, I want to explore what it takes to have a time-series database support the entire enterprise as an operational technology, rather than it being just another information technology, limited to monitoring services in the data center. Why is this important? Just like in the data center, time-series data allow us to make operational decisions in near real-time, rather than having to wait hours or days to make decisions based on traditional batch systems. Time-series data also allow us to look at processes historically, as well as build predictive models for the future. We can prevent problems before they occur, and seize opportunities as they emerge. But perhaps most importantly, in the industrial world, a time-series database tends to become a unifying platform, tying together many disparate systems—sensors, control systems, business systems, legacy systems—into a uniform and democratizing platform for collaboration, analysis, and decision making.
In this three-part series, I will explore three elements that I believe are essential for elevating a time-series database to an enterprise platform. In part one, I will explore considerations related to time itself. In part two, I will examine interfacing time-series data with asset metadata and asset models, in order to provide context to telemetry. In part three, I will consider how to reliably integrate the time-series platform with other systems, like stream-processing services and business systems, in order to build reliable and scalable applications.
Note that this series is not an introduction to time-series databases themselves. I am assuming that the time-series database supports the efficient storage and query of time-series data; that it can perform server-side aggregations; that it is scalable to millions of series; that it is fault tolerant and supports models for workload distribution and disaster recovery; and that it is easily deployable on cloud-native infrastructure-platforms.
Before I dive in, I will provide a bit of background on my perspective, so that you can appreciate where I am coming from.
My Perspective
The expertise and focus required to build a sufficiently reliable, scalable, and feature-rich time-series platform, is much more than most people anticipate, and is well beyond the resources of most organizations. I have supported homegrown time-series solutions constructed around a relational database or Cassandra that work up to a point, but fail to solve the unique challenges of time-series, especially at scale, or over long periods of time.
For over a decade, I worked as a software developer building a commercial time-series database, as well as the supporting infrastructure for reliable data-collection and publish-subscribe messaging. This time-series platform is probably still the most widely used time-series infrastructure in the industrial world. It is especially popular for electrical generation, transmission, and distribution, and in the process industries, like oil, gas, and chemicals. I really enjoyed working deeply on the unique challenges of time-series data. I am intimately familiar with what it takes to build a scalable, reliable, and secure time-series system for operational environments, and work with customers to support and evolve these systems over the course of many years.
For the past few years, I have been focused on building cloud services that support the real-time monitoring and closed-loop control of distributed, renewable-energy assets. Time-series are a core component of these systems, but the systems involve many other aspects—from integration with asset models, to stream-processing systems for real-time aggregations, to customer-facing APIs and applications. Although there is still room for a lot of innovation in the time-series space, given what I know about the challenges of building a time-series platform, I certainly do not want to build my own time-series database, preferring to incorporate an open-source or commercial offering.
Time
Obviously, one of the primary considerations for a time-series database is the handling of time itself, since it is fundamentally the secondary index (the primary index being the series). Despite understanding the importance of time, it is often underestimated, or considered too narrowly, when extending time-series data to an operational setting. We think that if we record time-stamped data in Coordinated Universal Time (UTC), have an efficient time index for storage and query, and only translate to local time when data are presented visually or used in a calculation, that we have time pretty well handled. These are extremely important foundations, but, in an operational setting, there are many more considerations.[1]
Within the data center, networks are relatively reliable; we generally have a good accounting of the services that are running; and these services are, for the most part, under our control, whether in our own data center, or provisioned from a public-cloud provider. We can often afford to lose a few samples without much consequence, and the retention requirements for most metrics are usually very short.
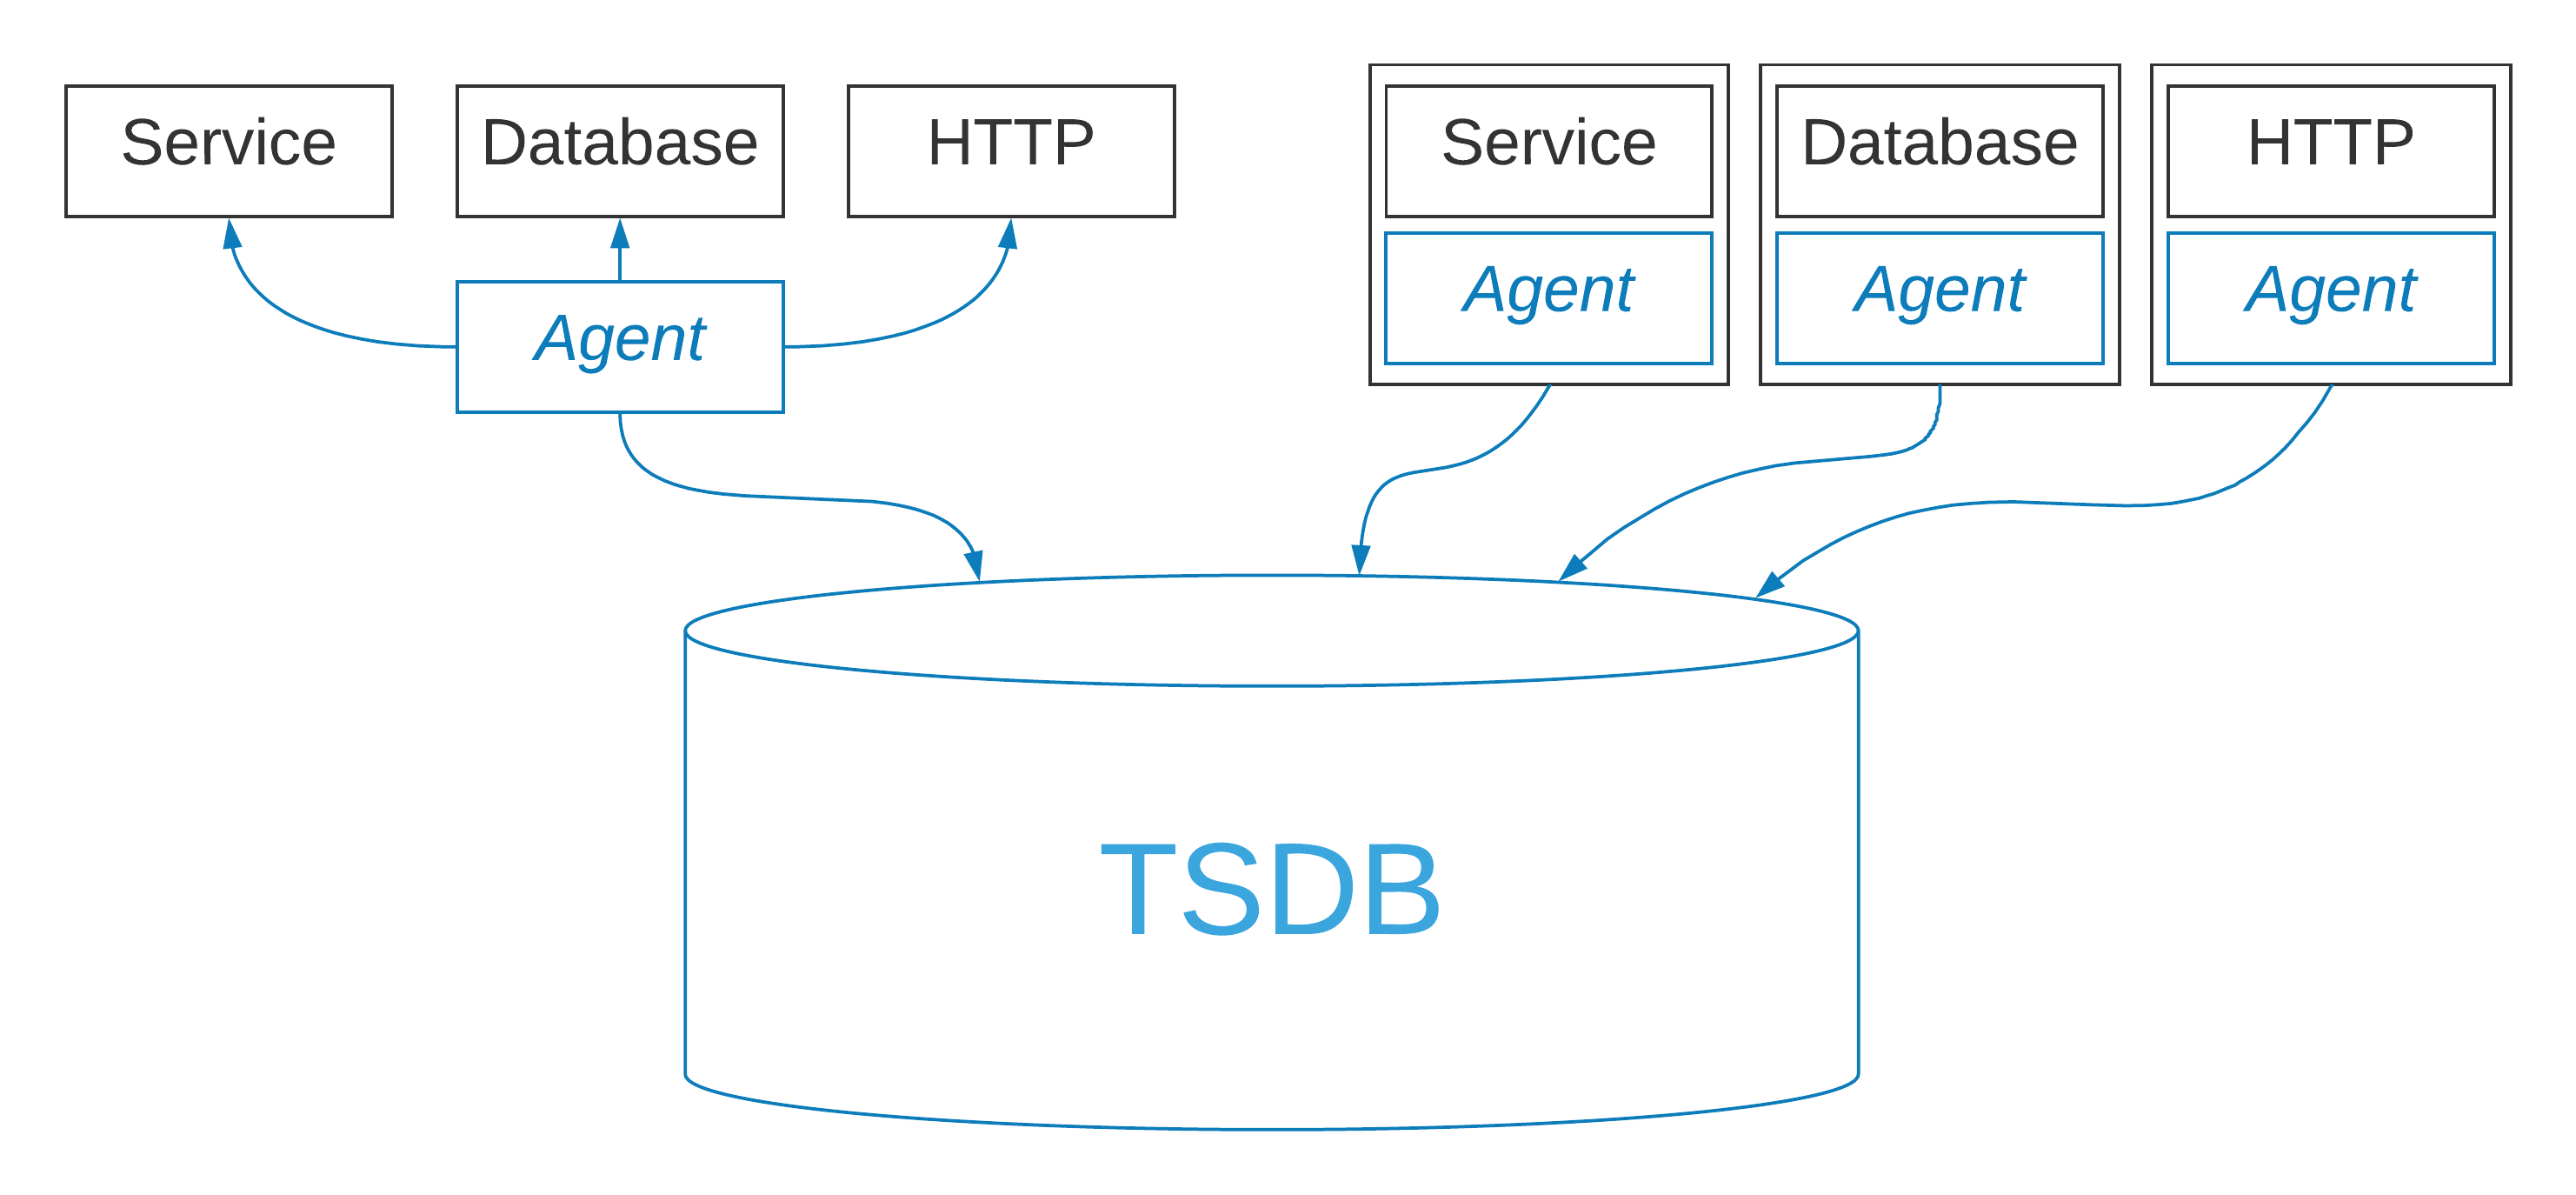
In the data center, service metrics are usually sampled directly from the service itself. One approach is to have a central agent that polls various endpoints and writes the samples to the time-series database. Another approach is to deploy a sidecar container along with the service. The sidecar approach is easy to manage and it makes application metrics immediately available as part of the deployment. Compared to a centralized metrics collection approach, the sidecar can also buffer samples in the event of a network partition or database maintenance, ensuring that there is no data-loss.
Collecting operational metrics in an industrial setting is a lot more involved. Whereas in the data center we can usually tolerate losing the odd sample, in the industrial world, often the objective is to have complete data collection, through network partitions, service failures, and regular software and hardware upgrades. Data loss is often treated as a critical situation. Industrial assets can be widely distributed and in harsh environments, with unreliable or intermittent network availability. Not all of these assets are necessarily even under our control—perhaps they are owned and operated by someone else, and we are just responsible for the maintenance contract. Data retention requirements are usually much longer, sometimes requiring the storage of high-fidelity data for the lifetime of the asset. Most importantly, these systems must be extremely reliable if we are going to operate our businesses on them.
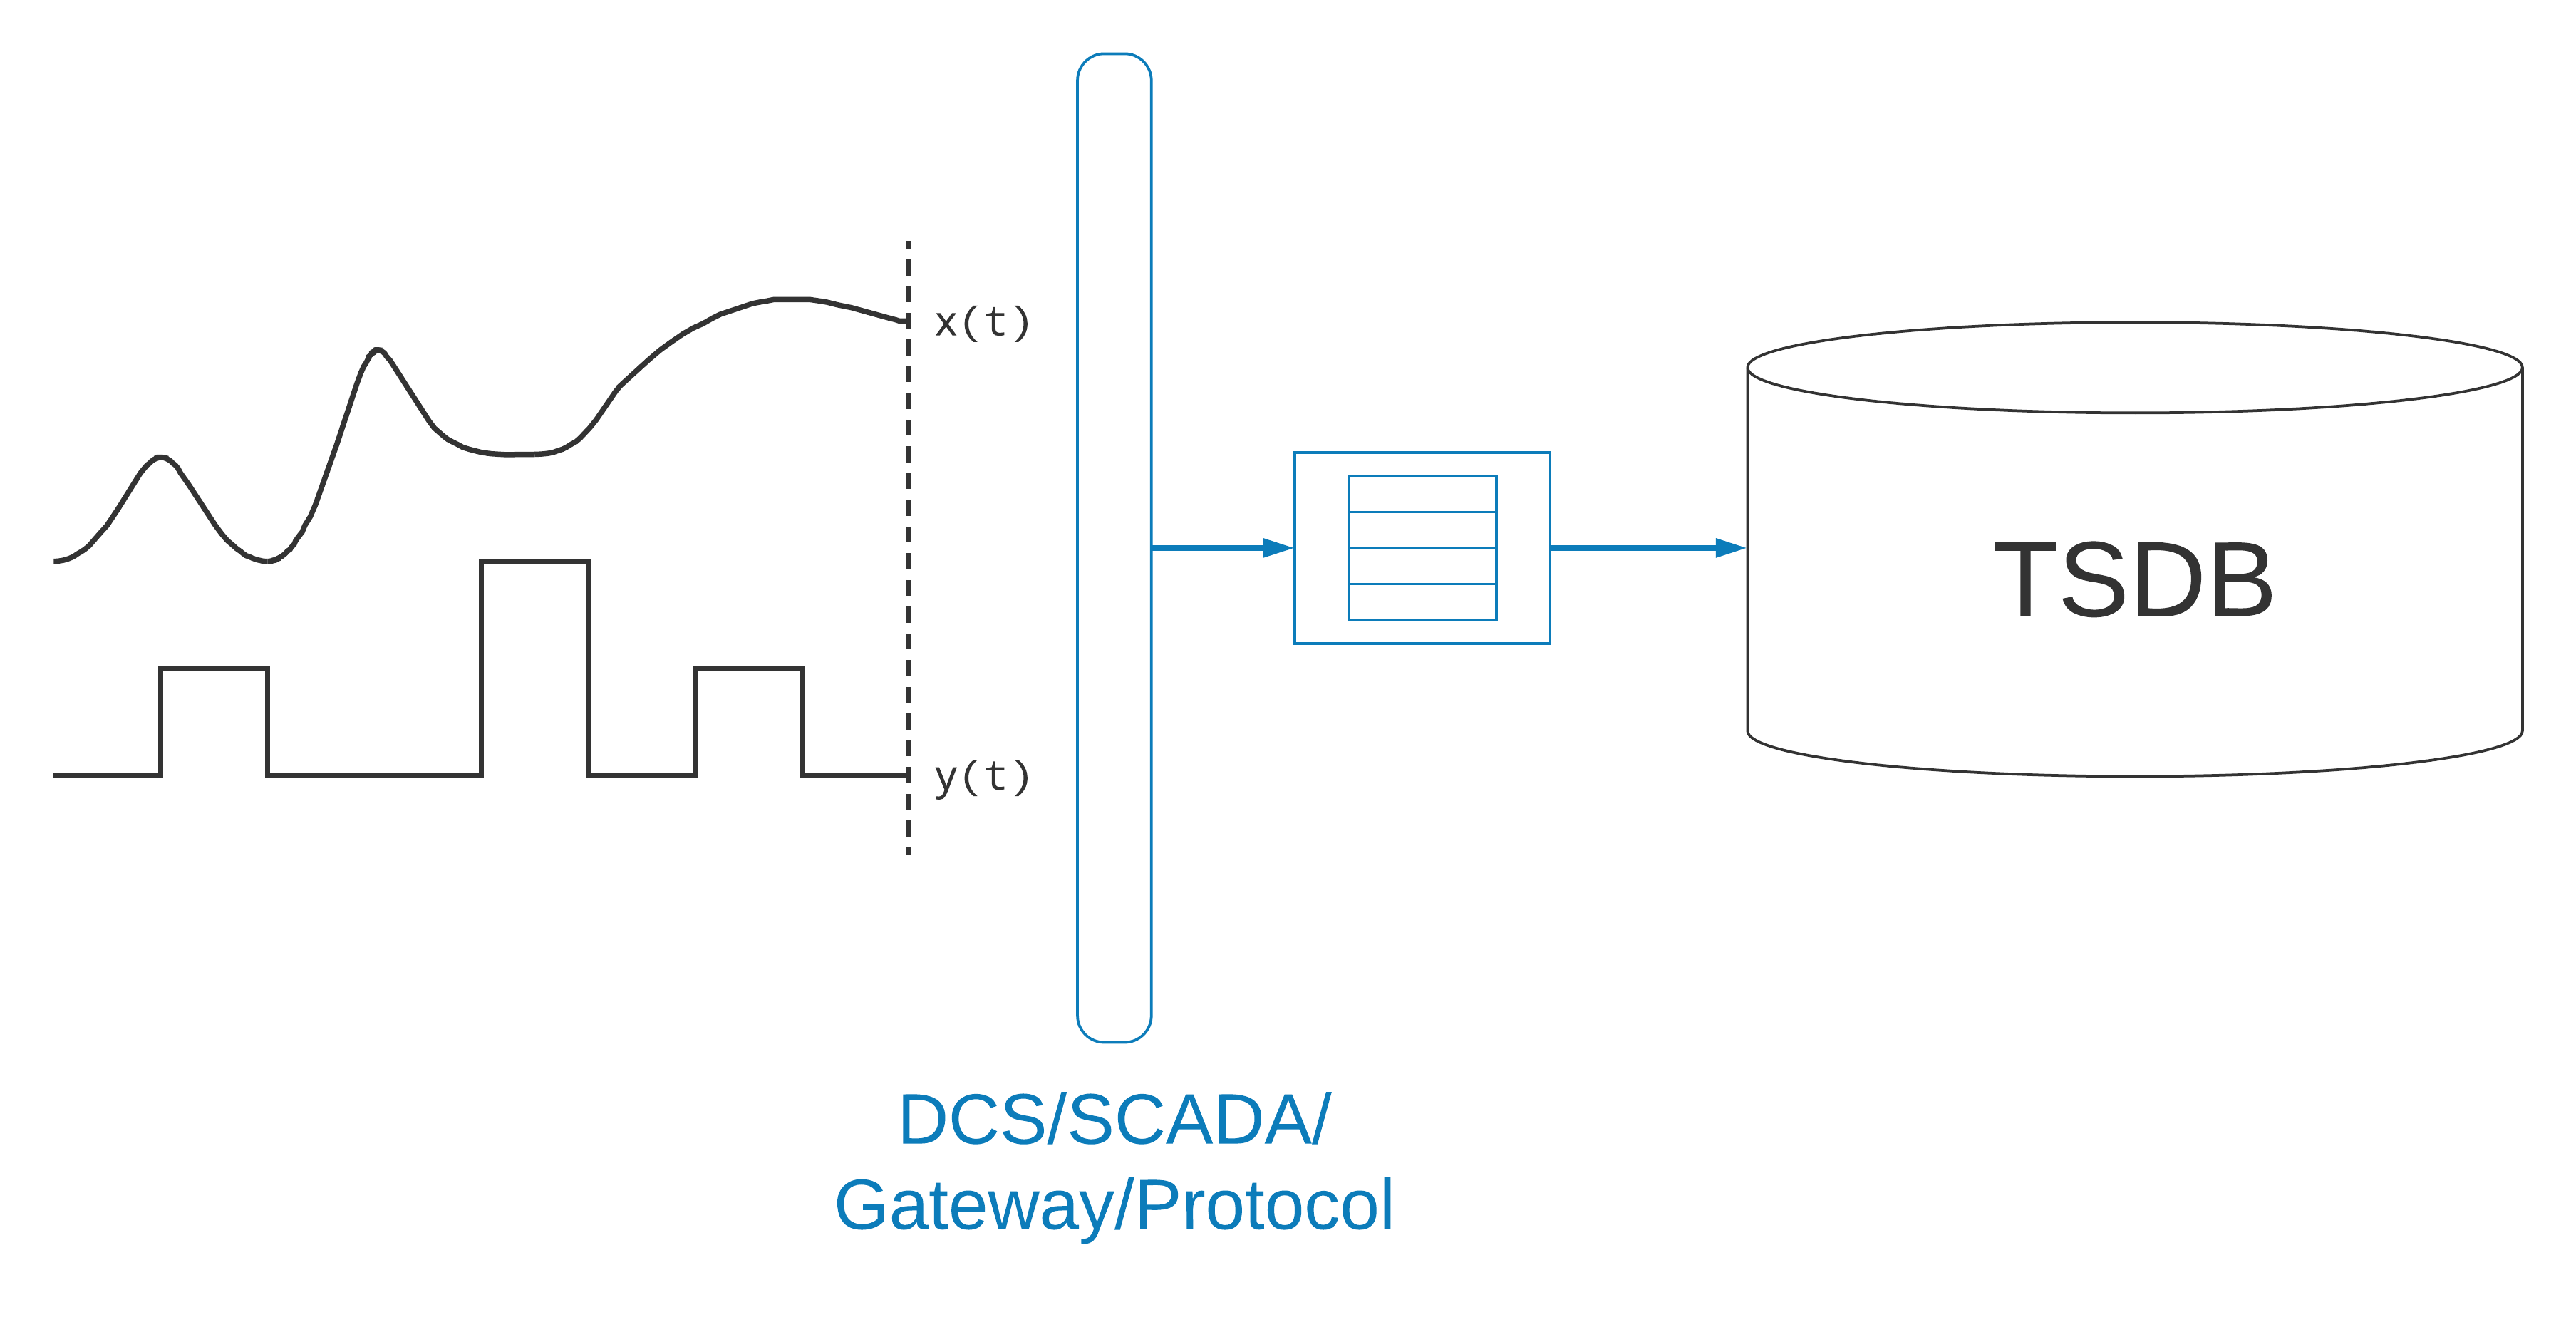
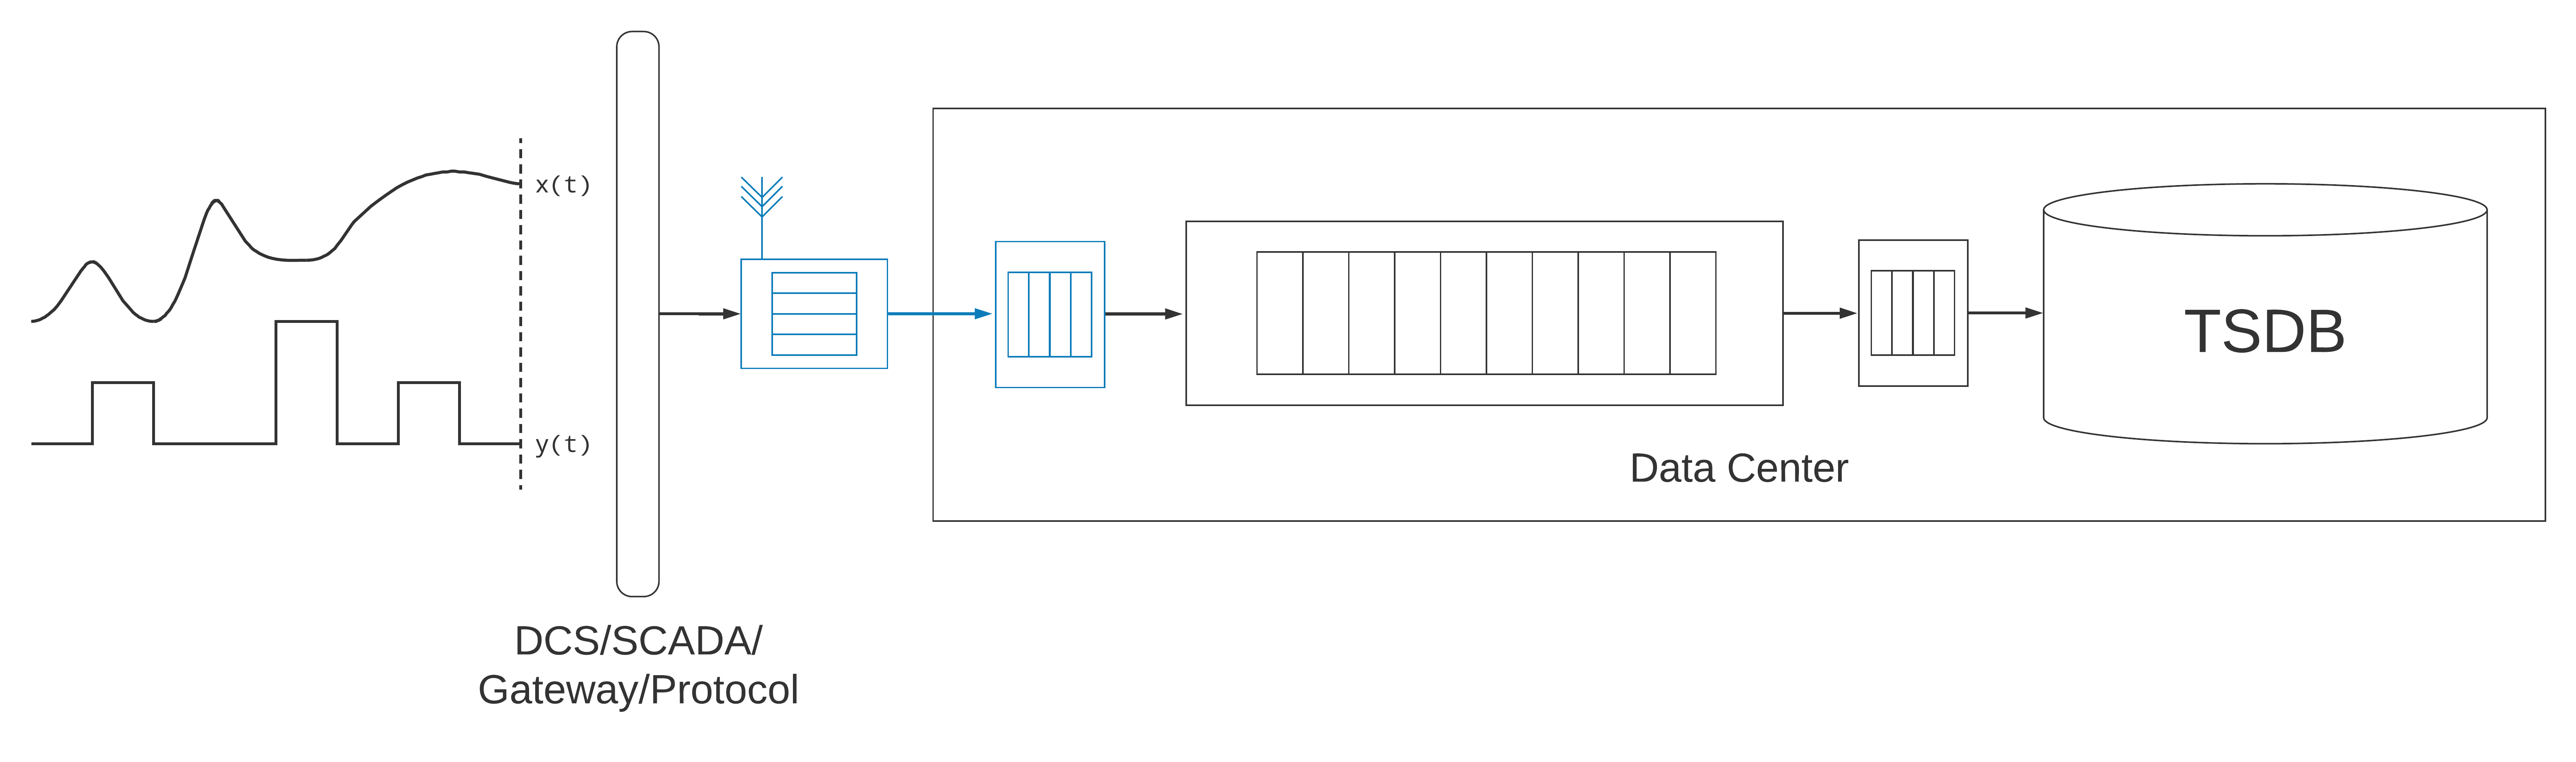
In an industrial setting, rarely is the data collection agent sampling the process directly. It is usually communicating with an intermediary—a sensor, a gateway, a supervisory control and data acquisition (SCADA) system, or a distributed control system (DCS). It might use a custom protocol, or a standard protocol like Modbus, DNP3, OPC, or MQTT. The process collecting the data can usually sustain a very large, durable queue of samples, perhaps for days, so that data collection will be complete in the event of a network partition to the time-series database. In terms of networking, this application will be located very close to the process; in some cases, it will have a direct physical connection. The data collection agent may also be redundant, to provide high-availability in the event of a failure.
Historically, the time-series database has been co-located, on premises with the industrial assets themselves, often maintained by the operational-technology staff, rather than the information-technology staff. Traditionally, the data collection agent writes the samples directly to the time-series database, sometimes writing to multiple databases for improved durability and availability. In other architectures, the database itself handles the replication of the data within a cluster. An increasingly popular architecture, especially for Internet of Things (IoT) and web-scale platforms, is to write the samples to a durable message-queue. The messages are then consumed and written to the time-series database by another process, which itself often has in-memory or persisted buffers of messages, to allow for efficiently batching writes to the database, or recovering from failures.
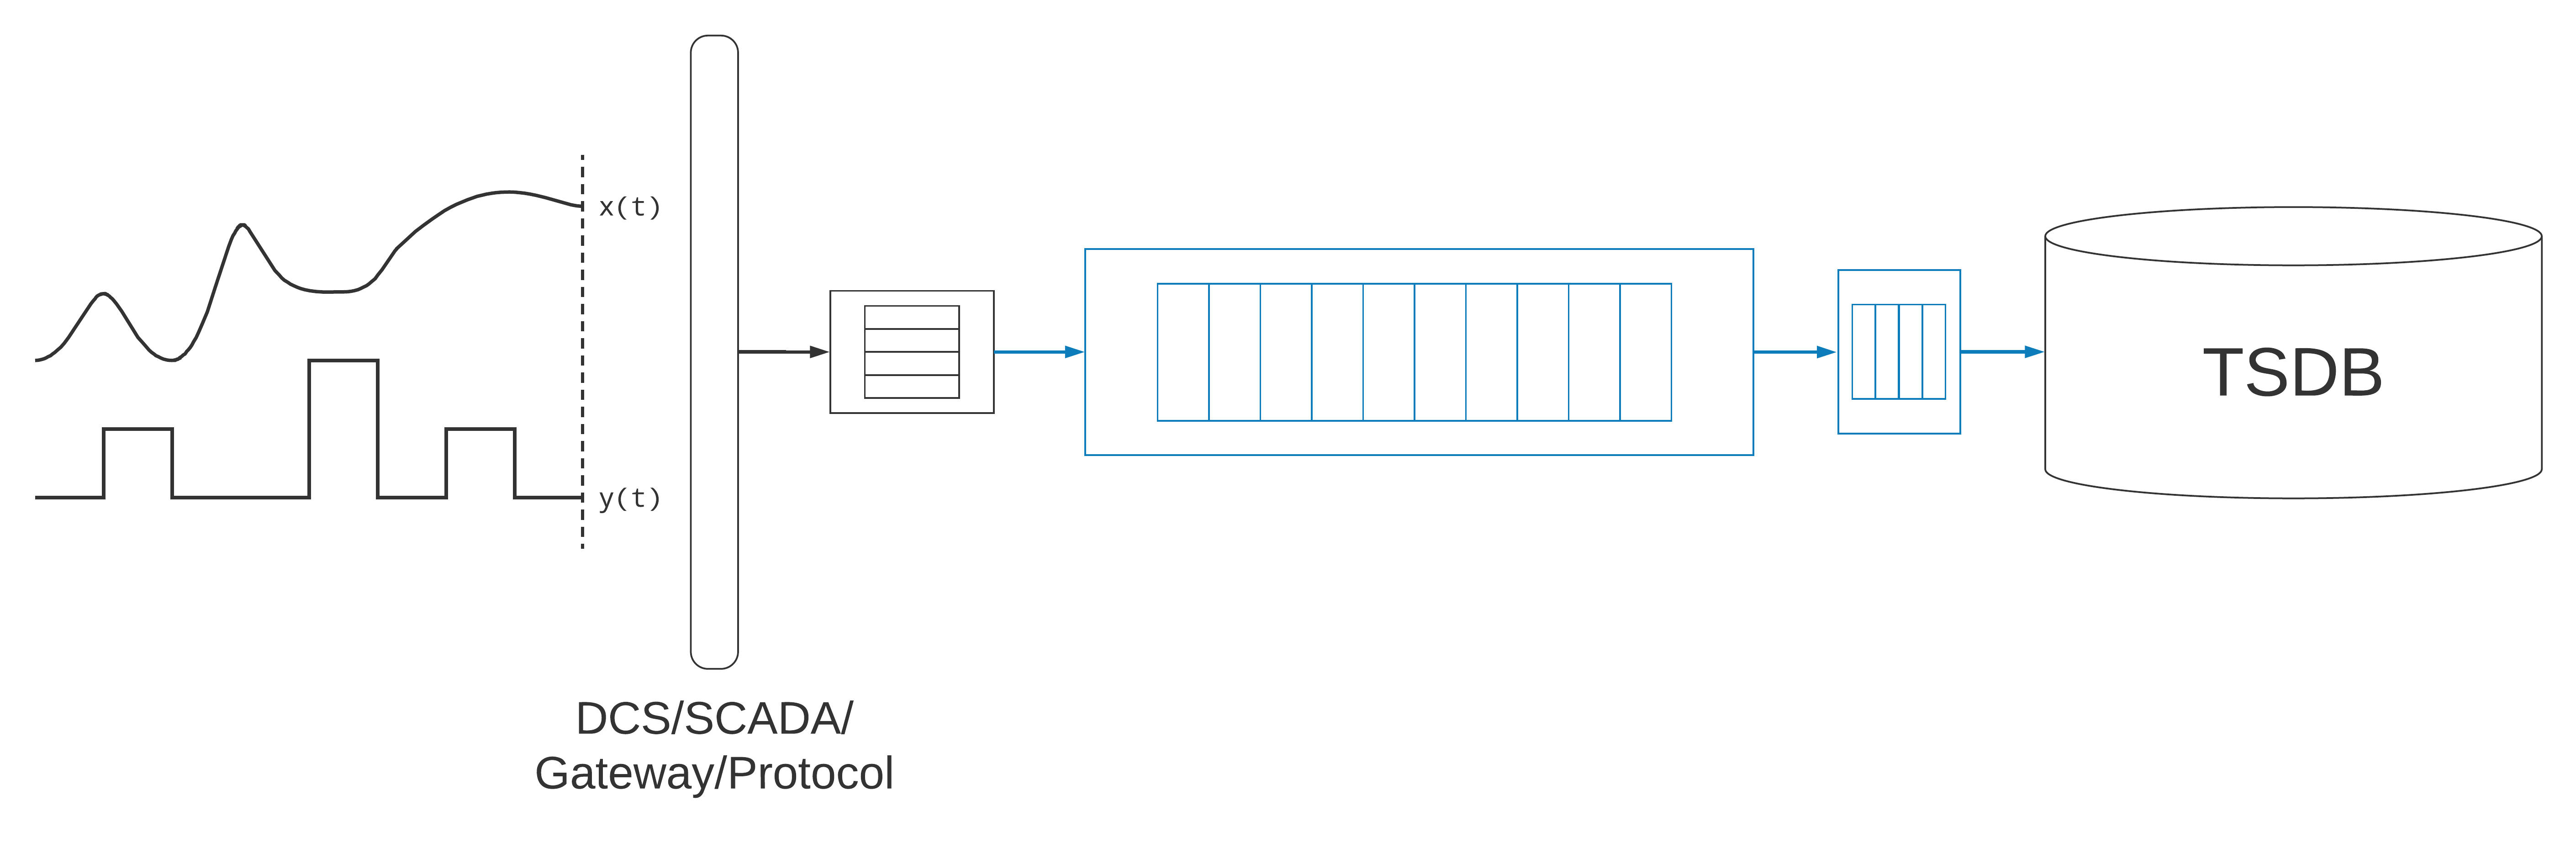
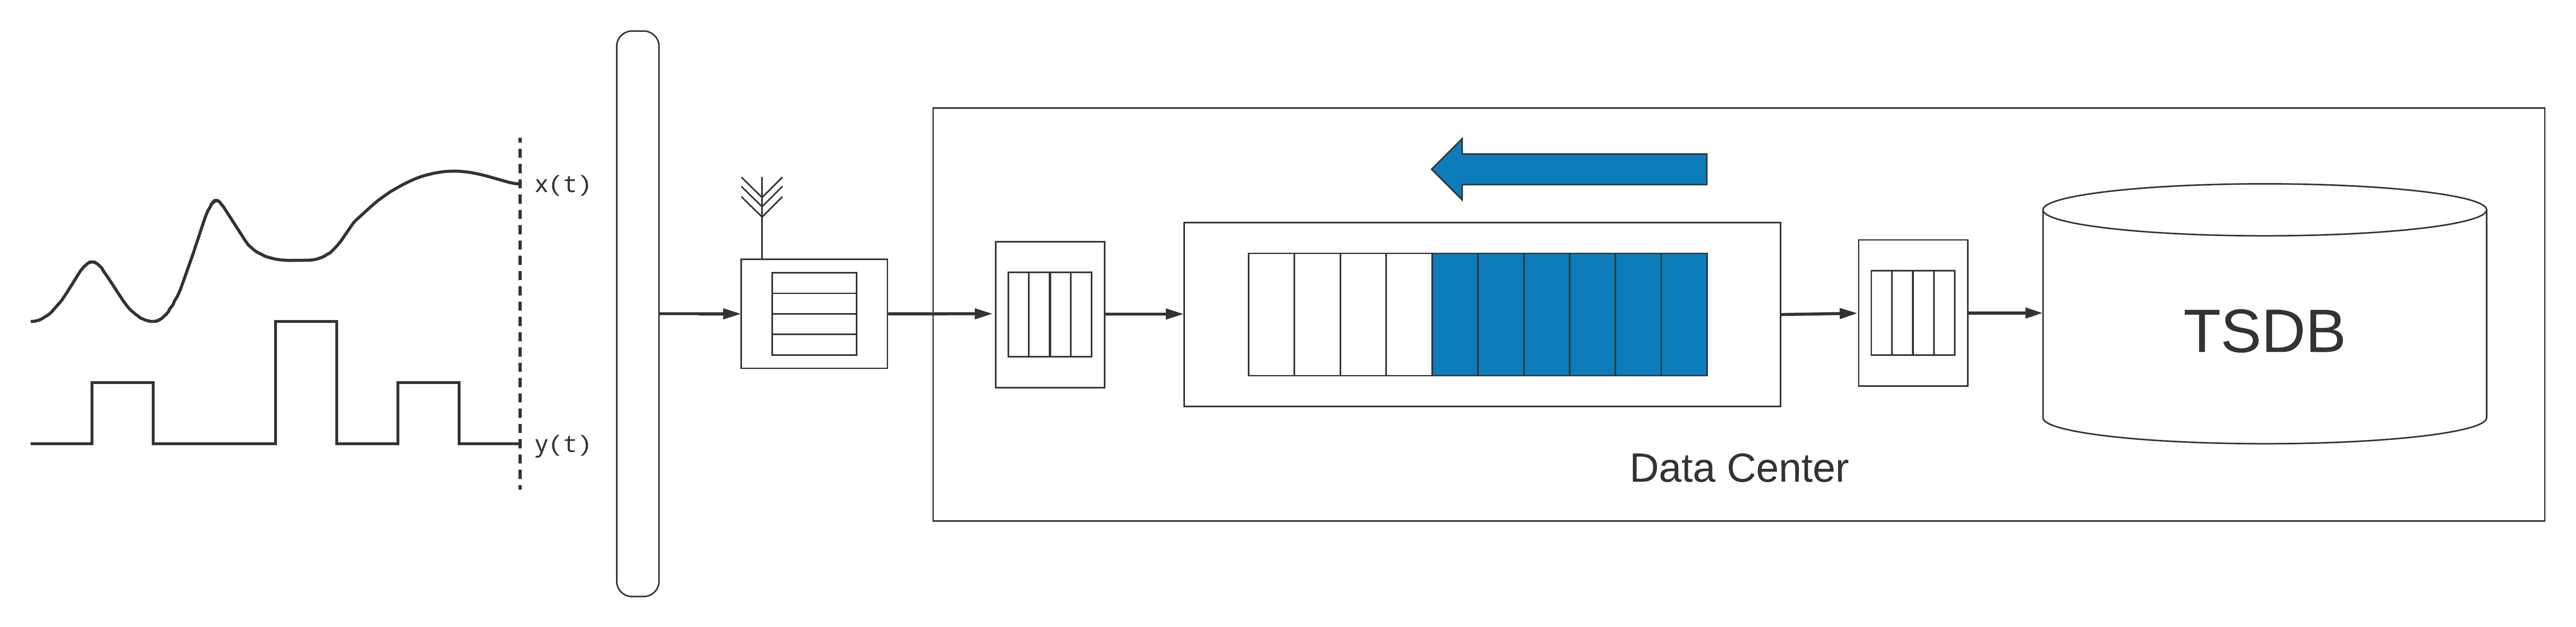
A durable message-queue provides improved reliability and operational flexibility, since the queue can be replayed and messages consumed more than once. This works really well with an idempotent time-series data-store. The durable queue supports recovering data after failures (e.g., a disk corruption), as well as adapting the ingestion pipeline to changes in business rules, or bringing a new database on-line. Since the message queue can be shared, it has the advantage of decoupling data collection from materialization in the database. It supports maintaining more than one time-series database in parallel, perhaps a primary and a backup, or instances for staging and production environments. It also means that the same messages can be consumed independently by other services, like stream-processing systems, or data-warehousing services.
As we increasingly monitor and control distributed assets, combined with the fact that people are more comfortable embracing cloud infrastructures, the durable message-queue and time-series database are often running in a remote data-center, or on a public-cloud provider. This means that the data collection agents may be communicating over wide-area networks, sometimes with periodic or intermittent network availability, or bandwidth constraints. Such an architecture introduces the need for a front-end service that handles connectivity and security, along with acknowledging writes to the data collection agent. This front-end application might be an HTTP or WebSockets server, or leverage a front-end IoT service from one of the public-cloud providers (e.g., Azure IoT Hubs). It may involve custom protocols, or standard ones like MQTT, AMQP, or XMPP. This service introduces its own unique dynamics to the data ingestion pipeline.
All of this is a far cry from the simple data ingestion pipeline of using sidecar containers in the data center. Because there are so many stages involved in the data ingestion pipeline, and because the data are being used to make critical operational decisions, latency becomes a central concern. In addition to the time the measurements were sampled, two additional timestamps emerge as important elements of the system. The first is the ingestion time. This is the time at which the data are enqueued into the durable message-queue. This timestamp is useful for measuring ingestion latency. Additionally, having an index of these timestamps is advantageous for replaying messages from the message queue from a particular point in time, to recover from failures, reprocess data, or bring additional systems or resources on-line.
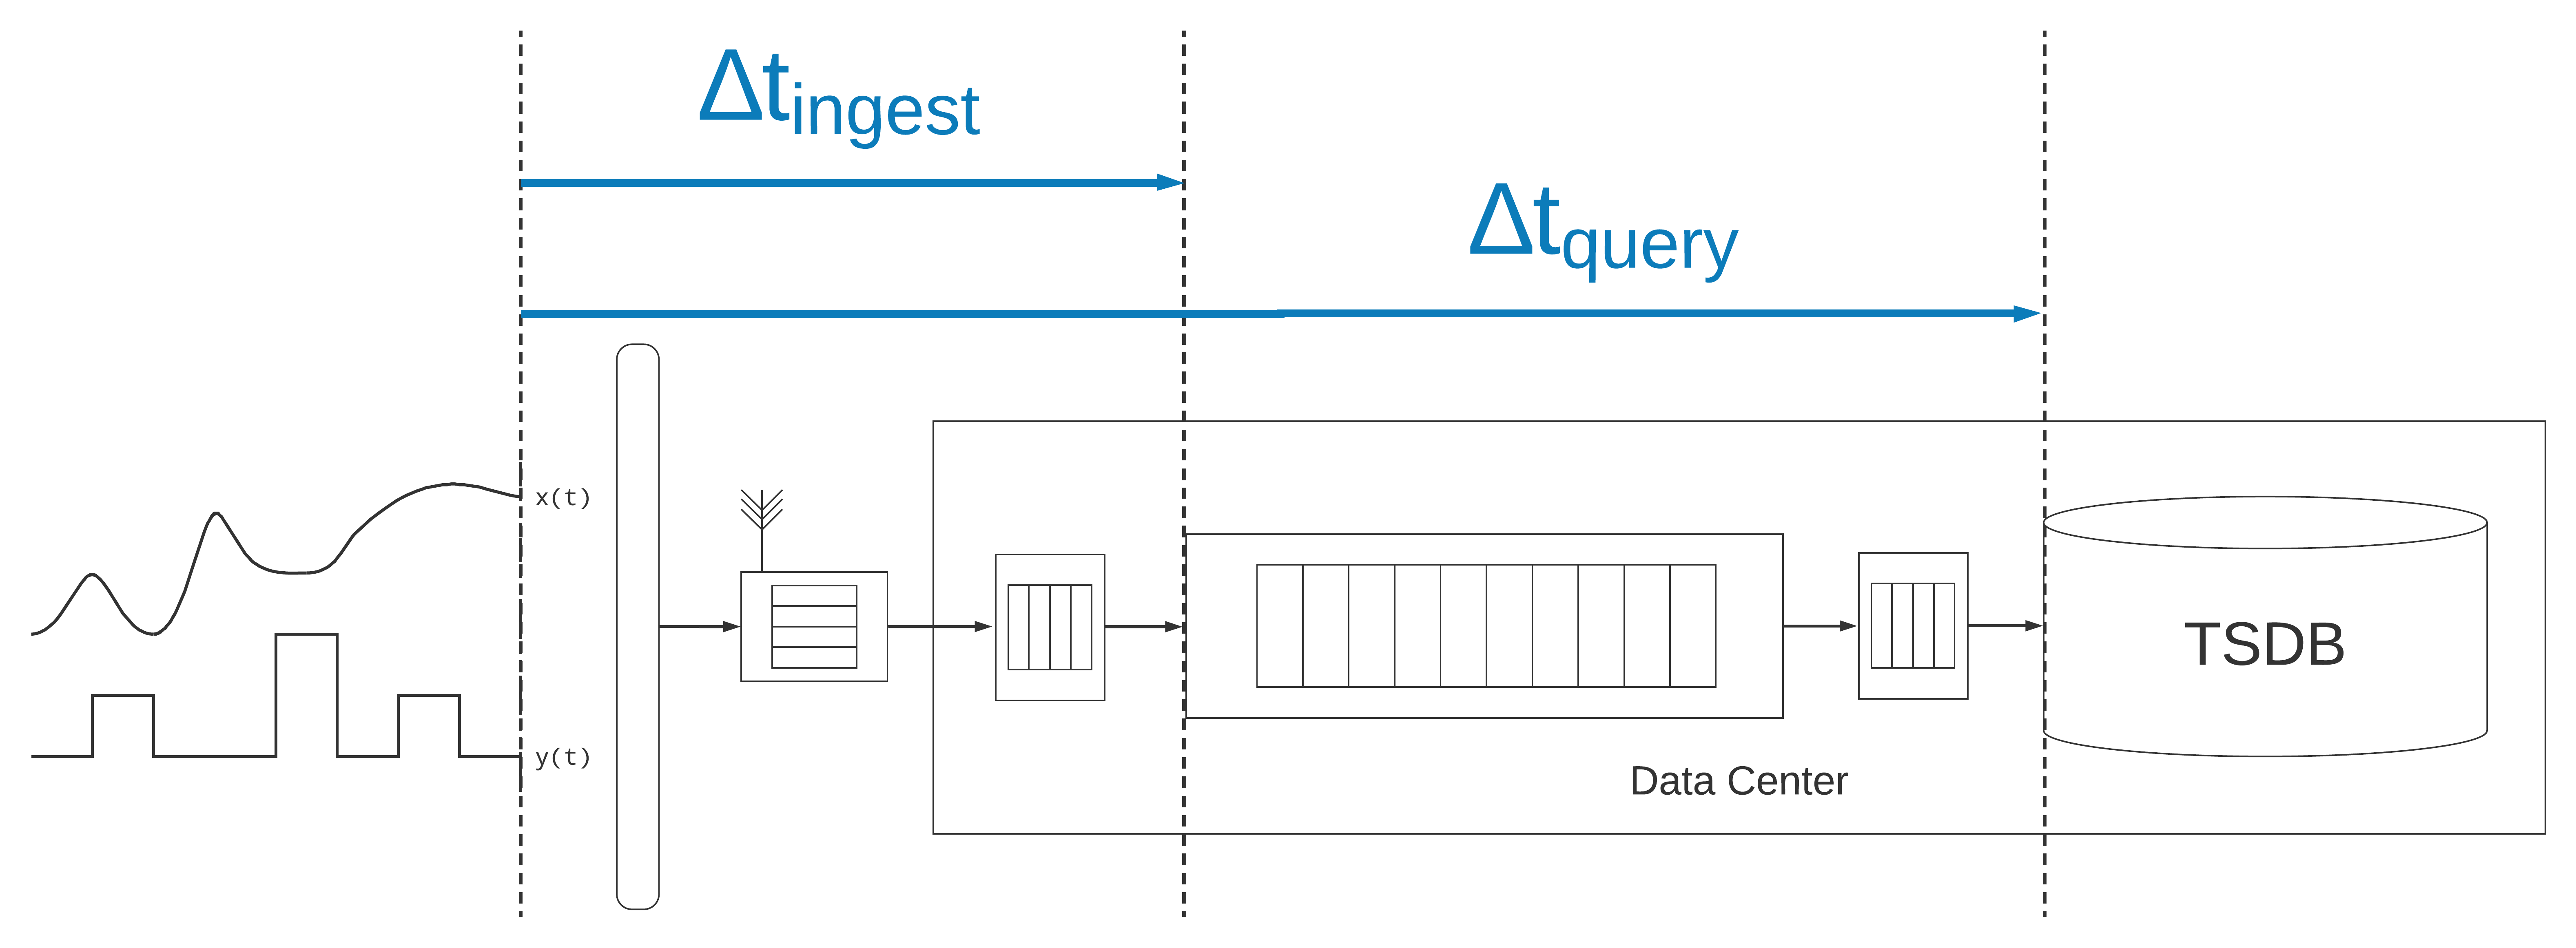
A timestamp of even more importance is the time at which a measurement was written to the time-series database and available for query. This timestamp allows one to answer the question: what data were available when a specific operational decision was made? The decision may have been made by an operator viewing a dashboard or human-machine interface (HMI), or the decision may have been made automatically, by an algorithm performing closed-loop control. Since these message-based systems are only eventually consistent, if data are delayed due to failures or other exceptions, a decision may have been made based on an incomplete or inconsistent (if only some streams are delayed) view of the process.
At scale, it is not realistic to record the ingestion latency and the query latency for every single sample in every single series. It is usually only realistic to record these timestamps for a subset of series, or a set of critical series, in order to monitor the performance of the system and maintain service-level agreements (SLAs).
The complexity of the ingestion pipeline raises some unique considerations with regard to revising data. First of all, since it is possible to replay messages from the durable message-queue, one needs to consider the impact this may have if measurements are being derived based on time (e.g., calculating the query latency that I just discussed, which would change if messages are processed a second time), or if data are being augmented, perhaps with metadata from other systems, because the queries returned from these auxiliary systems may be different over time.
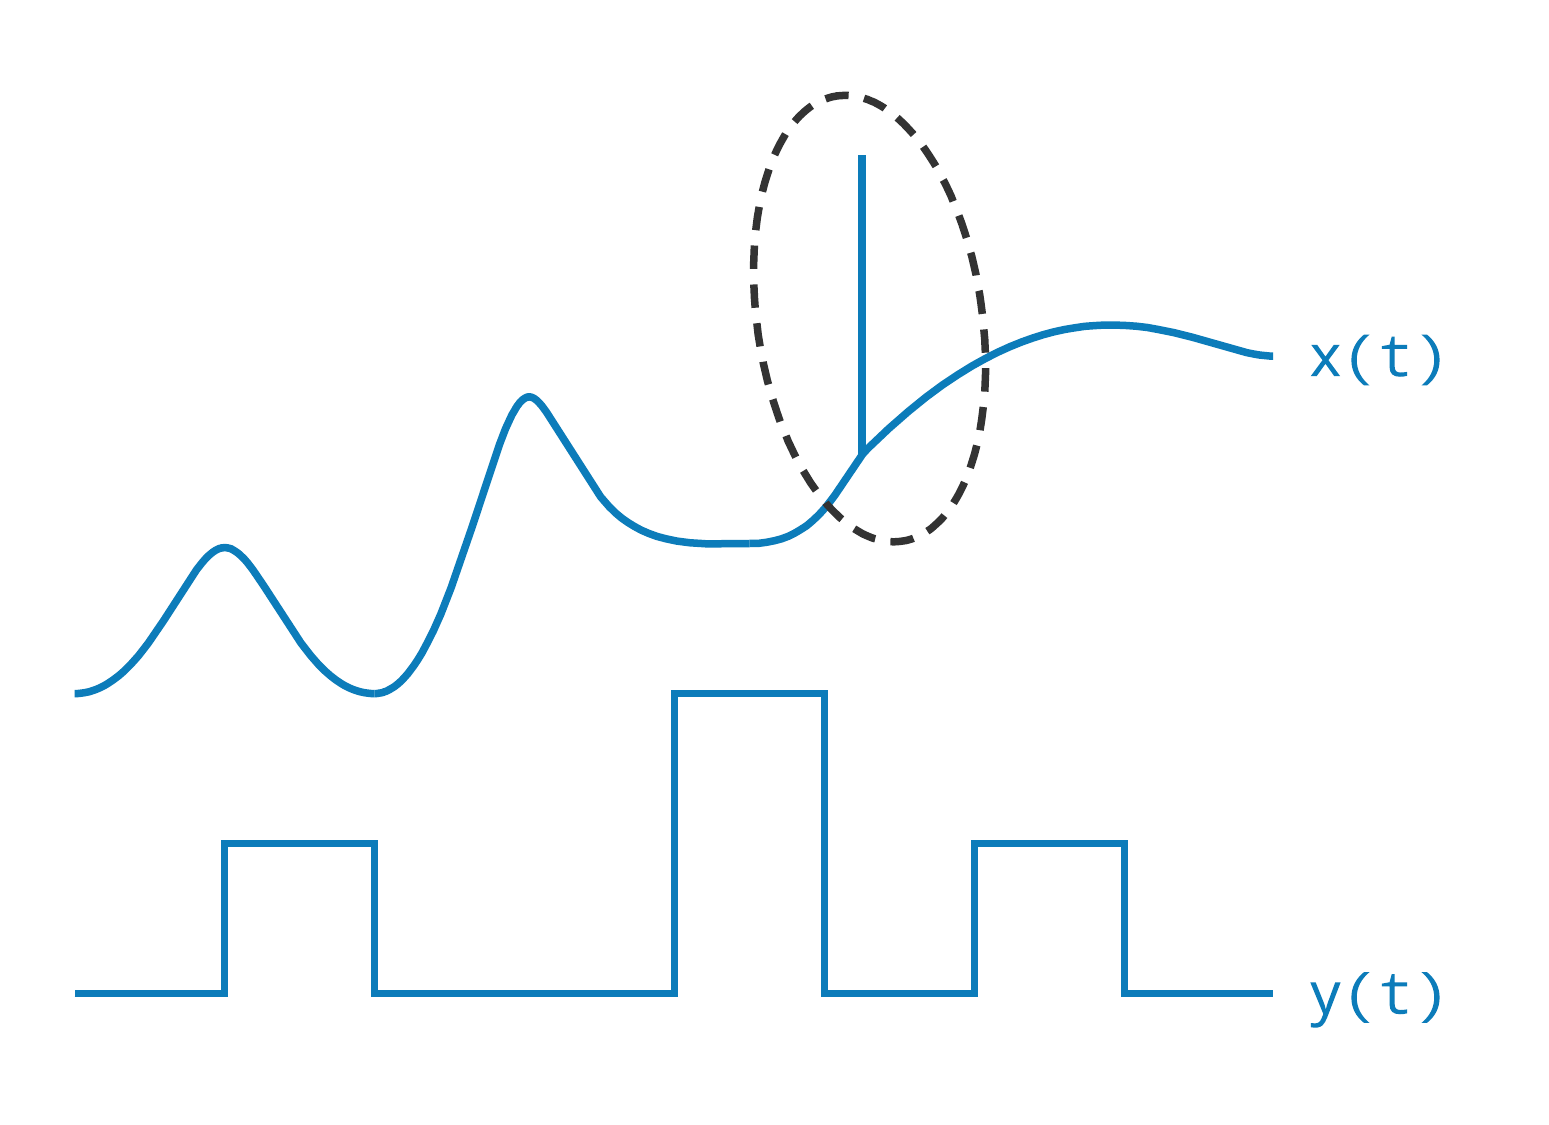
One also needs to consider what to do with anomalous samples resulting from incorrect sensor readings, software or firmware defects, or even human error in the case of data that are manually entered. For some applications, it may be acceptable to filter out erroneous samples and never write them to the time-series database. However, in many regulated industries—pharmaceutical manufacturing, or industries with environmental or financial regulations—it is common that all measurements must be recorded as sampled, without modification. It may be acceptable to annotate or even suppress an anomalous sample, omitting it from dashboards or calculations, but it still needs to be maintained in the time-series database as the system-of-record, making it auditable in terms of why it was noted as an anomaly, by whom, and when. Providing this flexibility in the time-series database can be challenging. Even if decisions about revising data are not driven by regulation, one often wants to record all events, including anomalies, in order to address operational issues, customer support queries, or drive product improvements. All of this means that the data ingestion pipeline usually requires a lot of business logic, especially around logging to identify exceptional assets and behaviours.
I want to conclude this exploration of time by examining how time changes at scale and then examine the importance of time-frames.
When managing only a small number of devices, it is reasonably easy to address problems and manage the time-series data effectively. At scale, inevitably there will be devices with clocks that are wrong, bad firmware, software defects, and unreliable connectivity. This can present a lot of challenges. For example, I have seen devices reporting data hours or days into the future, when they should be sampling and reporting data in near real-time. I have also seen devices repeatedly reporting the same measurements, days or months into the past, causing expensive modifications to files in the time-series database that have been idle and compressed. Identifying these devices requires an investment in the data ingestion pipeline to capture and log these behaviours. Once the data are written to the database, it is often too late to identify these behaviours. When data are reported late, we may also need to revise derived metrics that may have been incomplete, or we may want to maintain the original metric, since it was the one used to make an operational decision at the time. Sometimes we need the flexibility to record both.
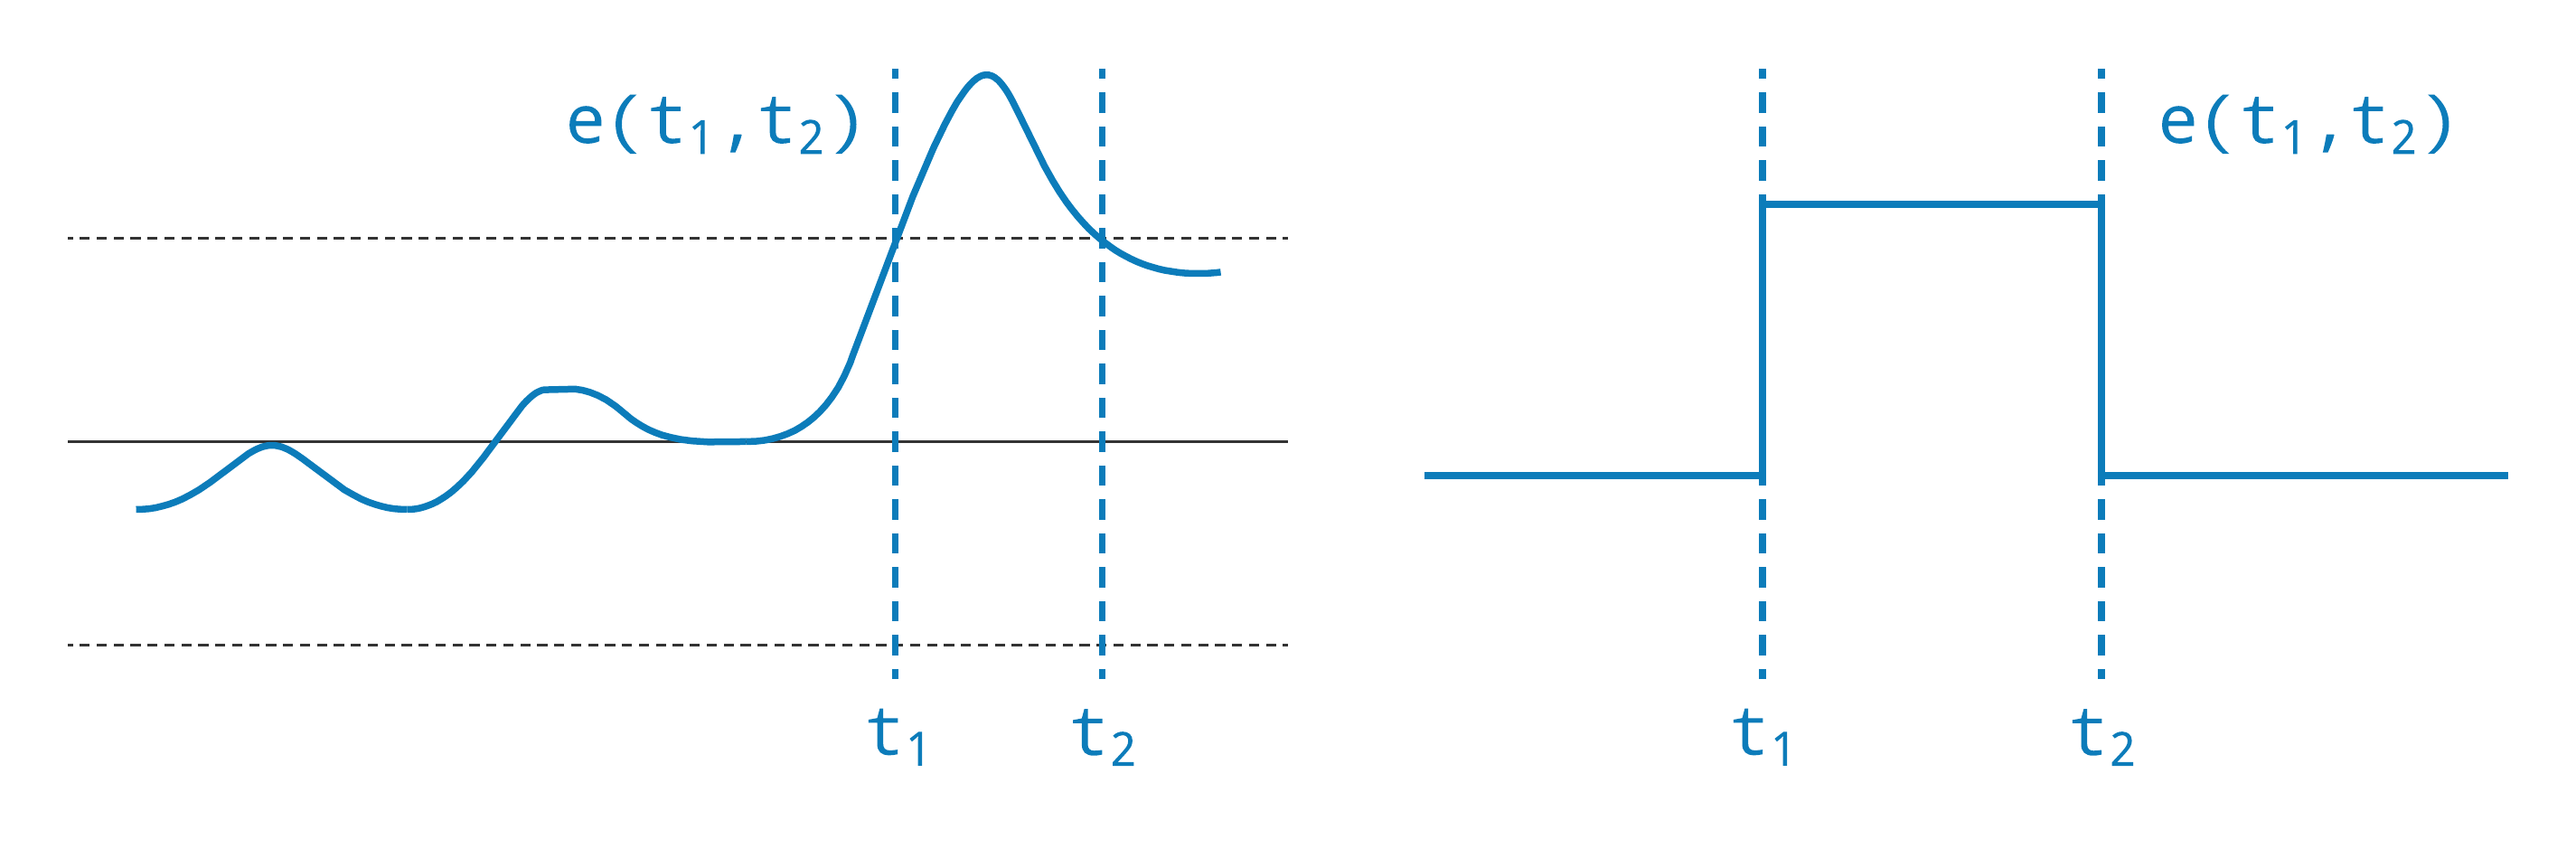
Finally, we are often interested not just in a single point in time, but rather a time-frame: an event with a start-time and an end-time. Time-frames might be predetermined and at regular intervals, like an hour, or a day, or a shift; or they may be dynamic and irregular, like a control-variable excursion, a battery discharge, or a set-point change. Many web applications support sharing context via time-frames through relative URLs that include the start-time and end-time, but time-frames need to be more integrated into the time-series platform than this. It is not just customer-facing applications that require this context—reports, calculations, or aggregations require the same context. We likely also want to attach metadata to the time-frame in the form of annotations or links. The time-frames themselves become a ubiquitous and first-class data-type of the system, providing context for the time-series data, and supporting queries like, what were all of the control variable excursions that started and ended within the past day?
To summarize, time is multifaceted and we need to consider a lot more than just sampled time. We must consider latency, both the time data are ingested and the time they are available for query; derived values when messages are replayed at a later date from the durable message-queue; and the time when anomalous samples are filtered, annotated, suppressed, or deleted. In an operational setting, the complexities of time necessitate a significant investment in the data ingestion pipeline for reliability, scalability, flexibility, and observability. Finally, often we are interested in time-frames, which have a start-time and an end-time, to provide context for time-series data.
In the next article in this series, I will examine integrating time-series data with asset metadata and asset models, in order to provide context to the underlying telemetry.
I explored some additional aspects of time that I will not discuss here in my article entitled Considering Time in a Streaming Data System. ↩︎